Market Guard® Methodology

Dynamic | Tactical Methodology
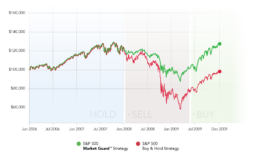
Hypothetical Bear Market Illustration

*Disclosure : The graphs illustrate an example of the S&P 500, ticker symbol SPY, from January 1, 2006 through December 31, 2009. The red line portrays a buy and hold approach. The green line represents utilization of a Market Guard® strategy by using a 200 day SMA technical indicator as a buy or sell signal. When signaled to sell, SPY is replaced with SHY, the 1-3 year Treasury Bond ETF. When signaled to buy, SHY is replaced with SPY. This is for illustration purposes only and does not represent a specific portfolio, model or individual client. Volatility in the index may be materially different than any actual model or portfolio allocation. For a complete disclosure, click here.
Target | Tactical Methodology
Hypothetical Bear Market Illustration
*Disclosure : The graphs illustrate an example of the S&P 500, ticker symbol SPY, from January 1, 2006 through December 31, 2009. The red line portrays a buy and hold approach. The green line represents utilization of a Market Guard® strategy by using a 200 day SMA technical indicator as a buy or sell signal. When signaled to sell, 50% of the SPY is replaced with SHY, the 1-3 year Treasury Bond ETF. When signaled to buy, SHY is replaced with SPY. This is for illustration purposes only and does not represent a specific portfolio, model or individual client. Volatility in the index may be materially different than any actual model or portfolio allocation. For a complete disclosure, click here.
Static | Strategic Methodology
Hypothetical Bear Market Illustration
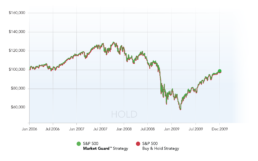
*Disclosure : The graphs illustrate an example of the S&P 500, ticker symbol SPY, from January 1, 2006 through December 31, 2009. The red line portrays a buy and hold approach. The green line represents utilization of a Market Guard® strategy with annual assessment and rebalancing only. This is for illustration purposes only and does not represent a specific portfolio, model or individual client. Volatility in the index may be materially different than any actual model or portfolio allocation. For a complete disclosure, click here.
When To Hold
KEEPING DISCIPLINED
Remaining in the market during periods of normal fluctuation is critical to success. Knowing you are invested with a strategy like Market Guard® can help provide peace of mind.
When To Sell
PROTECTING GROWTH
Market Guard® assesses the individual positions in the portfolio, signal a possible opportune time to sell, and attempt to capture any gains in the individual securities.
When To Buy
RE-ENTERING THE MARKET
Once certain indicators are met, Market Guard® will communicate the quantity of shares to purchase.
Intelligent Performance
The Market Guard® strategy was created with one simple concept in mind: to help empower clients with the highest probability of investment success, while helping to protect their investments along the way. At Market Guard®, we strive to understand the challenges that face investors every day. Therefore, we created multiple investment strategies, with an intelligent approach, seeking to achieve the level of success we believe every investor deserves.
Market Guard® Video
