Tactical Methodology

Market Guard® Target
The charts below will illustrate how the Target portfolios might react in both a bear market as well as a bull market by adjusting all individual equity investment positions within the portfolio, if necessary, from 50% – 100%.
Hypothetical Bear Market Illustration
The chart is an example of how Market Guard® utilizes technical indicators to help make non-emotional, methodical, and mathematical investment decisions that signal when to HOLD, SELL and BUY the individual investments within the portfolio. The period of time represented in the graph, we believe, provides a powerful example of all three of these potential triggering events.
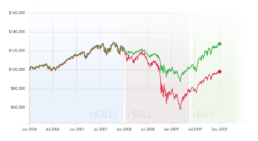
Keeping Disciplined
Remaining in the market during periods of normal fluctuation is critical to success.
Protecting Growth
Market Guard® will assess the individual positions in the portfolio and signal a possible opportune time to sell.
Re-enter the Market
Once certain indicators are met, Market Guard® will communicate the quantity of shares to purchase.
Hypothetical Bull Market Illustration
This graph is a hypothetical representation of the Market Guard® Target methodology if applied only to the S&P 500. It is not an illustration of actual performance of a fully diversified portfolio offered through Market Guard®. To discover the power of Market Guard’s® portfolio construction and management style, please contact a representative of Market Guard®.
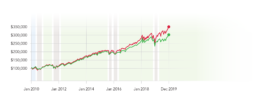
*Disclosure : The graphs illustrate an example of the S&P 500, ticker symbol SPY, from January 1, 2006 through December 31, 2009 and again from January 1, 2010 through December 31, 2019. The red line portrays a buy and hold approach. The green line represents utilization of a Market Guard® strategy by using a 200 day SMA technical indicator as a buy or sell signal. When signaled to sell, 50% of the SPY is replaced with SHY, the 1-3 year Treasury Bond ETF. When signaled to buy, SHY is replaced with SPY. This is for illustration purposes only and does not represent a specific portfolio, model or individual client. Volatility in the index may be materially different than any actual model or portfolio allocation. For a complete disclosure, click here.